GIS Aids in Planning the Terrestrial Phase of Mars Science Laboratory Mission
 Mission planners at the National Aeronautics and Space Administration (NASA) and Jet Propulsion Laboratory (JPL) hugged, hollered, and high-fived when the most sophisticated scientific instrument in the history of interplanetary exploration gently landed on the desert planet this past August. The Mars Science Laboratory (MSL), a compact car-sized rover designed to roam an ancient impact crater searching for clues to Mars' dynamic history, marks the seventh successful landing of a NASA craft on the planet. Outfitted with state-of-the-art optics and sensors, MSL will collect and transmit data back to earth for two years or perhaps even longer.
Navigating through space en route to another planet's surface was only half the battle for MSL engineers. To interact with Mars, Curiosity, the six-wheeled vehicle that transports the laboratory to predetermined locations to conduct various experiments, must contend with the Martian terrain itself. Strewn with jagged rocks and boulders, Mars presents innumerable physical hazards that can hobble—or bring to a screeching halt—any mission not meticulously modeled and planned. For this reason, NASA and JPL choose to map their missions using geospatial tools to perform modeling and analysis. MSL mission planners used a combination of ArcGIS and remote-sensing imagery collected in prior Mars missions to achieve the best possible awareness of Mars' diverse terrain and complicated geography.
Reconnaissance Imagery
 Imagery resources are crucial to construct maps for any terrestrial exploration of a planet, moon, or asteroid. Imagery datasets for MSL mission planning came from three active remote-sensing satellites that have been orbiting Mars for years collecting visible and multispectral photographic data of the Martian surface for their respective assignments. Of those three satellites, the Mars Reconnaissance Orbiter was the last to reach the planet, in 2006, and hence contains the most advanced optics and richest imagery datasets. Called the High Resolution Imaging Science Experiment (HiRISE), it provided the foundational basemap imaging that NASA and JPL needed to construct maps for future rover-based missions.
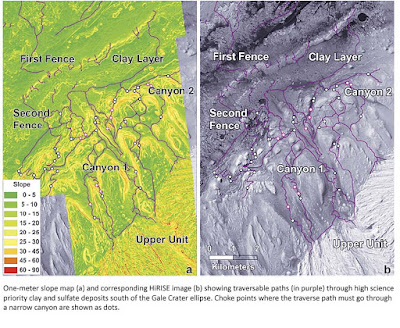
JPL imported or created hundreds of datasets derived from HiRISE surveys into ArcGIS so that models could be run to process potential landing sites. From that imagery, 30 possible landing locations were considered. Variables important to landing feasibility are geographic in nature, and geospatial analysis helped the mission team narrow down the list of possible landing locations. Geography-related factors included latitude for thermal management of the lab, elevation for sufficient atmosphere to slow the spacecraft, relief for control and fuel management during descent, and slope for rover stability at touchdown. Gale Crater was finally chosen as the study area because it best met the required science and safety requirements of the expedition.
Scientific Significance
 Channels and canyons on Mars indicate evidence of large amounts of moving liquid water in the planet's distant past. As such, MSL's primary assignment is to provide a more detailed understanding of Mars' chronology, geophysical processes, and life-harboring potential. MSL needed to land in a geologically rich area, but that also required relatively flat terrain nearby so that the rover can land safely and navigate with the least number of obstacles. Small-scale HiRISE imagery with derived rock density and abundance mapped within ArcGIS were essential in determining which sites were safe for landing, as well as traversable, to conduct its scientific experiments.
MSL mission planners created GIS projects for each site candidate to manage and quantify tens of gigabytes of geospatial information, such as digital elevation models (DEMs) and rock abundance maps from HiRISE. Processing the images and DEMs in ArcGIS helped the team establish the best horizontal and vertical geodetic control possible for entry, descent, and landing of MSL. The resultant maps covered roughly 85 percent of the landing ellipses—a percentage more than sufficient to support locational awareness during the entire mission.
Future
GIS will serve as a tactical and strategic planning tool during MSL's traverse operations, as well as serve as a pivotal dataset for creating and evaluating new science throughout the mission.
Source : ESRI.com
0 comments:
Post a Comment