Abstract
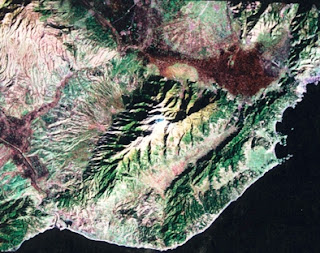 The study is about earthquake occurred on 8th October 2005 in Pakistan. Its epicenter was 34.4020 North 73.5600 east about 90 km north northeast of Islamabad. The purpose of research is to identify potentially hazardous areas according to landslides after earthquake. In order to identify the hazardous areas and changes after earthquake in these areas with the help of remote sensing and geographical information system, Maps, Satellite Images and Digital Elevation Model have been used as base data. For defining active landslides; Soil map, Aspect map and Slope map have also been used. Overlay Analysis between fault lines and Digital Elevation Model show that numbers of landslides have increased along these fault lines. The analysis between soil map and landslides shows that most of the landslides have found in Soil types of Rockland, Mani and Kurnol. Combination of Landslides map, Seismic map, Aspect map shows that 80 to 85 percent landslides are found in those areas whose slope angle is greater than and equal to 450. So, it is analyzed that these are highly hazardous areas.
Keywords: Landslides, Hazardous Areas, Fault Lines, Digital Elevation Model.
Introduction
An earthquake is a sudden movement of the earth, caused by the abrupt release of strain that has accumulated over a long time. For hundreds of millions of years, the forces of plate tectonics have shaped the earth as the huge plates that form the earth’s surface slowly move over, under and past each other. Sometimes the movement is gradual. At other times, the plates are locked together, unable to release the accumulating energy. When the accumulated energy grows strong enough, the plates break free. If the earthquake occurs in a populated area, it may cause many deaths and injuries and extensive property damage.
In Earthquake landslides are one of the hazardous phenomena. They create negative impacts, such as loss of life, property damage, and permanent landscape change. Type of landslide are described on the base of slope of the hillside, moisture content, and the nature of the underlying materials
Here we have to identify the dangerous areas regarding Landslides and potentially dangerous areas regarding Earthquake The major problems in Earthquake are Landslides and change in terrain features according to uplifting & down falling of earth. LANDSLIDES are rock; earth or debris flows on slopes due to gravity. These can occur on any terrain given the right conditions soil and the angle of slope.
Muzaffarabad and Balakot are study area. We use Satellite images and the DEM of before and after the Earthquake of the study area. DEM is the digital elevation model. There is the known active fault stretching NW-SE direction near the epicenter, some uplift (towards NE) and dextral (right-lateral) strike-slip activities were revealed. Many slope failures were triggered by the earth-quake, and 2,424 slope failures were detected in the area of 55km by 51km including Muzaffarabad. Almost all of the slope failures were located on the hanging wall of Balakot-Garhi fault There are many problems regarding Earthquake e.g Landslide, Change in terrain features, Disaster assessment, socio-economics disaster, rehabilitation process etc. Here objective is to cover only the mapping of landslide areas and the change in elevation of earth features.
Scanner, computer, GPS are used as hardware while ERDAS Imagine, ILWIS, Arc Map, MS Office etc are used as software Disaster management is the collection of policies, administrative decisions and operational activities, which are related to the various stages of a disaster. The main objective of disaster management is to increase preparedness, provide early warning, monitor the hazard in real time, assess the damage and organize relief activities (Ayanz et al., 1997). In disaster management, there is a need of geo-spatial information at different scale, such as topographic, geologic and soil maps, vegetation cover, road network, location and type of buildings, aerial photography, satellite imagery, and global positioning system data (GPS). Disaster management is examined in four phases: Mitigation, preparedness, response and recovery.
Mitigation: It is used to reducing or eliminating effects of disasters e.g. land use regulations, engineering works, building codes, insurance programs.
Preparedness: It is designed to minimize the loss of life and damage; facilitate the people timely and effective rescue, relief and rehabilitation Activities.
Response: This is Search and rescue activity. It is used to locate and recover disaster victims. Evacuation, emergency medical services and fire fighting are the other main activities in the response stage.
Recovery: This is the required situation to return normal situation of social life. Construction of permanent housing, full restoration of all services and complete resumption of pre-disaster state are the major response activities. In the preparedness phase of disaster management,
GPS is helpful in ground observations of building characteristics for loss estimation. With the help of GPS, GIS can provide important information for search and rescue operations. In recovery phase GIS can be utilized in organizing damage information, post disaster census information, the site selection of reconstruction.
The potential high-speed acquisition and dissemination of air and space borne data allows the event to be detected and monitored. The use of remote sensing technology provides quantitative base information about damage and monitoring to assist response operation, and also helps response and relief specialists in decision making.
According to the statistics:
1. 35 percentage of total losses has been caused by earthquakes
2. Remote sensing data is useful for post-earthquake damage assessment in improved spatial and temporal resolution. High temporal resolution is important for getting information in the time of emergency, while higher spatial resolution can provide damage information at building level. Structural characteristics of the settlements are the main determinant of the selection of resolution for urban remote sensing studies. As the size, densities and contrast of urban areas around the world are not same so we cannot determine the exact resolution for every application. Narrow streets and compact structures require higher spatial resolution for urban damage assessment (Rao, 2000).
Brief description of case study area
Research was carried out on the case of the Northern Pakistan earthquake (Mw 7.6) of October 8TH, 2005 occurred in the Kashmir region. Some uplift on northeast side and dextral strike-slip crustal deformation occurred on the existing active fault (Balakot - Garhi fault). 3-D crustal deformation map was produced using Synthetic Aperture Radar amplitude images. Approximately 2,424 slope failures were identified from the interpretation using SPOT5. Almost all of Stereo-images were occurred on the hanging wall of the fault and near the fault. The study area is 4km-wide zone from the fault on the hanging wall, we calculated 2-D (horizontal) deformation aspect from the 3-D crustal deformation map, we selected 979 large slope failures whose size is 15.8m by 15.8m and more, and we overlaid the large failures’ slope aspect on the horizontal crustal deformation aspect. Many large slope failures faced SW and S direction as a result, it was found that this anisotropy aspect is correspondent to that of planner crust deformation. This fact concludes that aspect of slope failures may be mainly controlled by the direction of the displacement of the earth surface. There is the known active fault stretching NW-SE direction near the epicenter, some uplift (on the NE side) and dextral (right-lateral) strike-slip activities were revealed.
 |
| Earthquake Magnitude in different years |
Post-earthquake damage assessment using Remote sensing data
After an earthquake it is challenging task to determine the damage structure in an urban area within limited sources. Ground surveying is also time extensive and man power work. It is necessary to identify the exact location of impacted areas in the first 72 hours after disaster for quick mobilization response and relief. This information is valuable for response activities, which includes search and rescue operations, access control and re-entry to the impacted area, debris clearance, restoration of utilities and lifeline repairs and inspection, condemnation or demolition of buildings and other structures (FEMA, 1996).
By using remote sensing, damage concentration in urban areas can be located in a shorter time compared to conventional ground survey methods. Satellite imagery and damage map shows the distribution of damage in urban areas. The information can be used in search and rescue operations (SAR) and emergency actions, such as identification of damage areas, escape routes and estimation of causalities developing and implementing strategies for recovery and restoration activities, such as defining locations for temporary housing
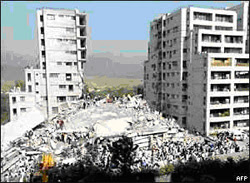 |
| Margala Tower, Islamabad after Oct. 8, 2005. |
Research problems statement and justification
There are some limitations for the application of post-earthquake damage assessment to practical life.
Problem definition will be carried out according to this evaluation. Remotely sensed data can be carried out in several ways e.g. multi-temporal approach, which requires two main images (pre and post-earthquake) of the affected area that are compared to identify changes, It is used to shown change detection in the major methodology to access the post-earthquake damage.
The main principal assumption is that the time gap between pre and post-earthquake images main principal assumption should be as short as possible to eliminate and substantially reduce to occurrence of non-disaster related changes. The second assumption of the change detection analysis is that changes in land cover result in changes in radiance values.
The second methodology for damage assessment is to use post-earthquake images for visual interpretation (Chiroiu & Andre, 2001) or texture analysis (Mitomi et al., 2000). These methodologies provide much more flexible and practical solution, as they do not depend on the availability of pre-disaster imagery.
There are different limitations for accessing proper data e.g. for satellite imagery revisit time of the sensors, cloud coverage, cost of the high spatial resolution imagery etc.
The limitations can be overcome by integration of different data sources. Integration of moderate resolution of space-borne and airborne imagery can complement each other at regional and local level to improve the damage information.
Fault lines
Fault start from a single point, the slip movement along its whole length may be hundreds or thousands of kilometers. Seismic waves are generated at the initial break point. The energy is very high near the break point. Here it has greater potential for destruction. The Break point is called the earthquake focus. Epicenter is directly above the break point.
Earthquake has different characteristics such as Surface faulting, Aftershocks, Tsunamis, Tremors, vibrations, Liquefaction, Landslides. It has different adverse effects e.g. Physical damage, Casualties, Public health, water supply.
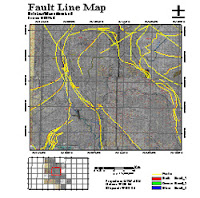 |
| Fault Lines in Balakot and Muzaffarabad. |
Landslides
These are a type of "mass wasting". It denotes any down slope movement of soil and rock under the direct influence of gravity. "Landslide" encompasses events such as rock falls, topples, slides, spreads, and flows. It can be initiated by rainfall, volcanic activity, earthquakes, change in groundwater, disturbance and change of a slope by man-made construction activities, or any combination of these factors. It can also occur under water, causing tidal waves and damage to coastal areas. These are called submarine landslides."
These are usually occurring in hilly or mountainous areas with low slope stability. Landslides create negative impacts, such as loss of life, property damage, and permanent landscape change.
Its size usually depends on the geology and the initial cause of the landslide. Slope of the hillside, moisture content, and the nature of the underlying materials define the type of landslide. Geology, Morphology and Human are the causes of landslides There are different types of causes of landslides. These are the most damaging causes of landslides around the world.
 |
| Landsliding in Balakot |
1- Landslides and water
The primary cause of landslides is slop saturation of water. It can be occur in form of snowmelt and changes in ground-water levels, rainfall, water-level changes along coastlines, canals, earth dams, and banks of lakes, reservoirs, canals, and rivers. Flooding and sliding are closely related to each other. Usually these both events frequently occur in the same area. Landslides may cause to reduced the capacity of reservoirs to store water and overtopping of reservoirs
2- Landslides and seismic activity
Landslides usually occur in mountaneous areas because of ground shaking or shaking of soil materials. The result of rock falls may also caused loosing of rocks.
3- Landslides and volcanic activity
Volcanic activity is the most overwhelming reason of landslides. Snow can be melt by the volcanic lava, soil, water, and ash. It rapid movement may happen on the steep slopes of volcanoes. Flanks of volcano may become the cause of damage structure in flat areas around the volcanoes
Hazardous landslide areas
Hazardous landslide areas are very dangerous for living creature. These are not habitable such as steep hills, Steep road-cuts, Existing landslides or historic landslides, below culverts, V-shaped valleys, canyon bottoms, and steep stream channels, outlets of canyons and areas where slopes are not maintained
 |
| Landslides and Fault Lines on Muzaffarabad |
Types of landslides
The term "landslide" shows the downward and outward movement of slope-forming materials including rock, soil, artificial fill, or a combination of these. These materials may move by falling, toppling, sliding, spreading, or flowing. The types of landslides have been classified on the bases of these parameters such as Slides, Falls, Topples, Flows, Creep, Lateral Spread
 |
| Landslides in Balakot, 2005 |
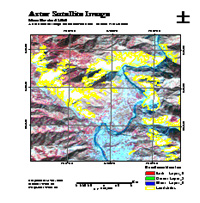 |
| Landslides in Muzaffarabad, 2005 |
Methodology
Acquisition of Data
Aster Stereo Images, Maps, Satellite images has been acquired from different data sources.
Aster Stereo Images
Aster DEM of 2000 and Aster DEM of 2005 has been used. Aster data has been used for generation of digital elevation models and hazard monitoring. Asters Stereo Image has been used Because of its off-nadir sensor pointing capability. It can collect the stereo pairs to generate high resolution DEM. It offers a 30m spatial resolution. These images of Northern areas of Pakistan has been acquired from ITC Holland for clipping the study area and making slope maps, aspect maps and also for analysis purposes.
Maps
Soil maps, Seismic maps and Fault line maps have been acquired from different sources. Soil maps (Before disaster) of Balakot and Muzaffarabad have been acquired to know the soil characteristics of Balakot and Muzaffarabad from Soil Survey of Pakistan.
Seismic maps of Balakot and Muzaffarabad have been acquired for the identification of hazardous areas of Balakot and Muzaffarabad from NESPAK.
Fault line maps of the study area have been acquired for analysis purpose from NESPAK.
 |
| Soil Map of Balakot Muzaffarabad, 2005 |
Satellite Images
Landsat ETM plus Image, Aster Ortho Images Satellite images has been acquired for visual interpretation.
Data Preparation
Data preparation has been completed through Scanning, Georeferencing, Sub setting, Digitizing and Attribute entry. Maps and Satellite images has been Georefrenced for identification of different locations and analysis purposes.
Digitization and Attribute entry
DEM AND ASTER ORTHO images of Area of interest have been clipped through sub setting. Seismic Maps of Balakot and Muzaffarabad Seismic Maps of Balakot and Muzaffarabad have been digitized for classification and its attributes are entered in the table by NESPAK and its attributes have been entered in the table. Landslides have been digitized from ASTER_ORTHO images.
Soil Survey of Pakistan has digitized soil Maps for classification according to the soil type. Fault lines from Fault line maps have been digitized. Attributes of soil types, characteristics etc have been entered in Soil and Seismic Maps.
Processing
These are the data processing steps.
- Soil map classification
- Seismic map classification
- Fill sinks
- Slope Map
- Aspect Map
- Sub setting
Soil Map Classification
Soil maps have been classified according to the soil types. Soil is classified into Rockland, Maria, Batgran shohal , Khurita, Mani, Nara , Shaldar, Ban, Paras, Kurnol, Chhapri, Baragali, Didal and Kaghan.
Classification of Seismic Map
NESPAK has classified Seismic maps of Muzaffarabad and Balakot according to its hazardous zones.
Fill sinks
Fill sink operation has been used to removed the local depressions (sinks) of DEM .
Slope Map
Slope maps of Dem of 2000 and 2005 has been clipped through applying spatial query in ILWIS and categorized into four classes Low, moderate, steep, steepest, where the slope angle is equal to and greater than 45° is considered as Steep slope. By Omer Ayden in International Conference on 8th October 2005 Earthquake in Pakistan “A Geodetic Evaluation of failures of Natural and cut slopes caused by Kashmir Earthquake of October 8, 2005 and their implications on civil infrastructures and site selection”.
Aspect Map
Aster_DEM_2000 and Aster_DEM_2005 are the aspect maps. These are used to show slop directions.
 |
| Aspect Map of Muzaffarabad Balakot |
Sub setting
Slope map has been clipped according to soil by applying the query in ILWIS.
Methodology
To know the influence of physical parameters of landslides, we have to know the correlation between the occurrence of landslide and parameters such as soil type, slope, land use, elevation data, moisture content geology and seismic intensity can be analyzed. Through querying and overlay analysis the resultant maps we may conclude our results according to our research questions.
Analysis
To know the influence of physical parameters to landslides the correlation between the occurrence of landslides and parameters can be analyzed.
As land use, moisture content is not available so we may be able to analyze the influence of landslides by using the slope, soil type, seismic intensity and elevation data through overlay and querying these maps.
1- Landslide and Soil Map Analysis
The resultant map of Landslide and Soil Map after applying the spatial query in ILWIS, it show the soil type where landslides exist. These are Batgran Shohal, Ban cultivated, Ban rockland, Baragali, Kurnol, Nara, Mani, Maira, Rockland, Paras cultivated soil types.
Through visual interpretation and spatial query analysis it is concluded that maximum of the landslides are present where Rockland, mani and Kurnol soil types are found.
 |
| Slope Map of Balakot and Muzaffarabad |
 |
| Soil Map of Balakot Muzaffarabad |
2- Seismic and Landslide Map Analysis
The seismic hazard microzonation maps of Balakot and Muzaffarabad have been categorized into four classes according to its hazardous conditions. These are Highly hazardous, High hazardous, Medium hazardous and Low hazardous.
Through overlay analysis between Seismic and Landslide maps it is concluded that the most of the landslides have been found in highly hazardous areas and the residual landslides are in high hazardous areas.
 |
| Seismic Hazardzonation Map of Muzaffarabad, 2005. |
 |
| Seismic Hazardzonation Map of Balakot, 2005 |
3- Slope, Aspect and landslide Map Analysis
After overlay and querying analysis of slope map and landslide map it is concluded that 80 to 85 percent landslides have been occurred at slopes greater than 45 degree. According to the research slope has been divided into four classes low, moderate, steep and steepest
After overlay and querying analysis of Aspect map and landslides it has been concluded that the 80 to 85 of the landslides occur at west, southwest and northwest directions.
The Aspect map has been acquired according to landslide map by applying the query in ILWIS.
 |
| Landslides in Balakot and Muzaffarabad according to Aspect Map, 2005 |
Elevation Model Analysis
For the study of elevation changes between DEM 2000 and DEM 2005. The Elevation values of Digital Elevation Model of year 2005 have been subtracted from elevation values of Digital Elevation Model of year 2000. By overlaying the fault line map on this map we can view easily that the changes are lie along the fault lines especially in Northeast area, which is closer to the Epicenter. But there are no definite results about this analysis.
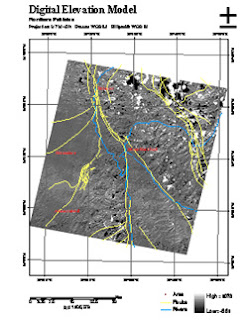 |
| Changes shown along Fault lines. |
Conclusion
The disaster assessment is an evaluation of a natural occurrence. It should be accomplished through the field survey of the affected areas within the limited resources. There is a need for information about the extent and the concentration of damaged area in critical hours. The information should be accurate, reliable and provided in a timely and appropriate manner.
Remotely sensed data make us able to depict disturbed vegetation, denuded hill slopes, and shallow landslides etc in the natural terrain.
The identification of risk areas, rate of destructions/causalities and understanding of post and pre disaster scenario becomes easy to understand by using GIS and remote sensing derivation of hazard zonation maps.
According to the slope map and landslides analysis it is estimated that Maximum of the landslides occurred where slope angle is greater than 45 degree. Through analyzing Aspect map and landslides it is concluded that the 80 to 85 percent andslides occur at west, southwest and northwest directions.
Overlay analysis of seismic map digitized landslide map shows that most of the landslides exist at highly hazardous areas and residual landslides exist in high hazardous areas. It also shows the probability of occurrence of landslides at high hazardous regions and most of the landslides occur at the soil types of Mani, Rockland, Maira, Ban Rockland, Kurnol, Nara and Baragali.
Since the soil type of high hazardous areas and highly hazardous areas are same so there is also a probability of possibly occurrences of landslides. It has also seen that after earthquake the area of landslides increases from 2.669 square Kilometers to 5.314square Kilometers.
Recommendation
The study has shown the dangerous areas regarding earthquake. GIS based research has also provided maps, which are helpful in planning and development. These are also useful in early warnings so we may save from further loss. Landslides have also identified in affected area within short time with the help of GIS tools but it is not the end of research. The further study can be procceed by using more topographic information or high-resolution spatial data.
1- By adding the more information like geomorphologic, Geologic, land use etc the Hazard map would be formed.
2- Further research can be made on the Elevation change.
Source : Geospatialworld.net

0 comments:
Post a Comment